
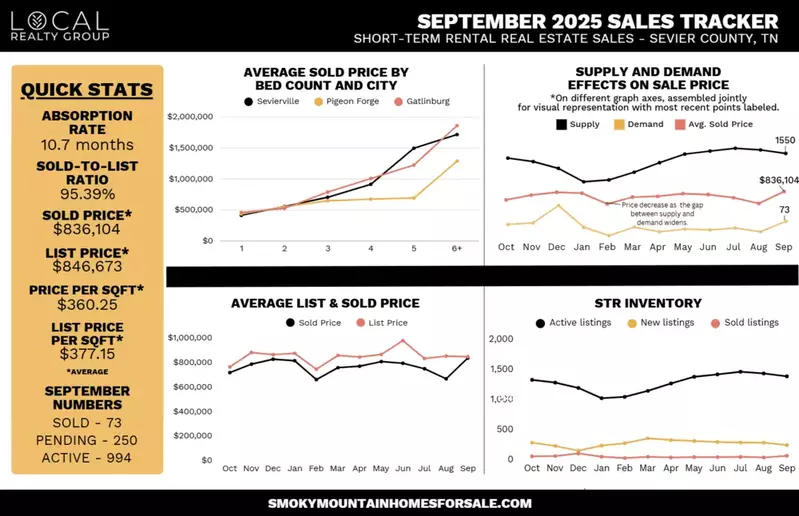
The September 2025 Short-Term Rental (STR) Sales Tracker data for the Smoky Mountain market provides key insights into the real estate market trends for short-term rental properties. This data is essential for understanding the pricing, inventory, and sales patterns in this real estate market. Let’s break down the key findings from the September 2025 STR sales tracker:
Average Sold Price by Bed Count & City
In the September 2025 STR sales tracker, the average sold price by bed count and city shows a significant price increase as the number of bedrooms in properties increases. Sevierville and Pigeon Forge see moderate price increases for properties with more than 3 bedrooms, while Gatlinburg sees a sharper rise in prices, especially for larger homes (5+ bedrooms). The price trends across these cities indicate that larger homes are in high demand, particularly in Gatlinburg, which may suggest a preference for larger rental properties in this area.
Supply and Demand Effects on Sale Price
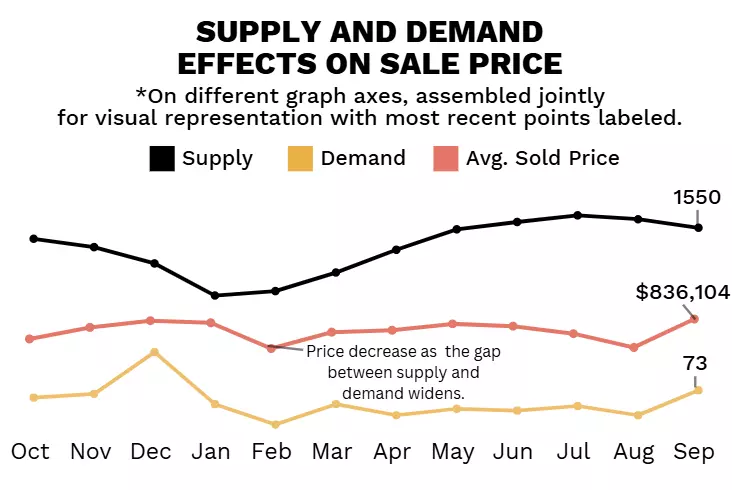
The STR sales tracker reveals a growing discrepancy between supply and demand over the months leading up to September 2025. While demand saw a peak in early spring, supply has remained relatively steady, resulting in a downward pressure on prices. The widening gap between supply and demand suggests that while there is a continued influx of listings, demand is not growing at the same rate. This may indicate that the market is becoming more competitive, with sellers having to adjust expectations to meet market conditions.
STR Inventory
The September 2025 STR sales tracker shows the activity of active listings, new listings, and sold listings. Active listings have remained relatively high throughout the year, peaking in the summer and staying elevated through September. New listings show a steady rise through the spring and summer, possibly as more investors enter the market or owners look to capitalize on high demand for short-term rentals. Sold listings have remained relatively steady and have actually increased in September, which may correlate with the pricing trends.
Average List & Sold Price
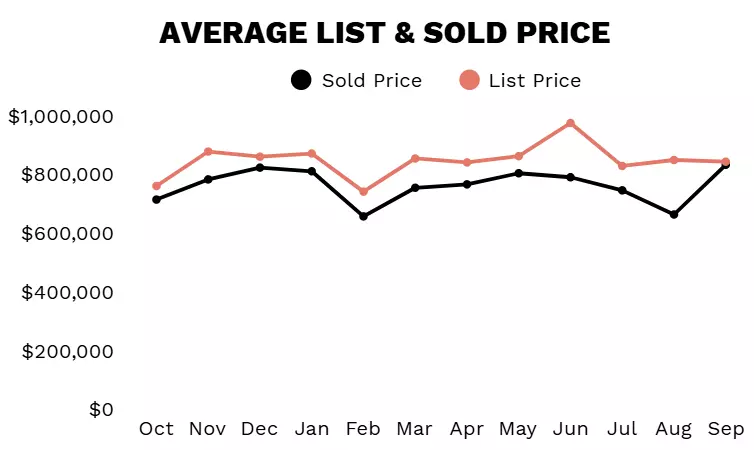
The STR sales tracker reveals an interesting trend for average list and sold prices. Average prices for both listing and sold properties have been relatively stable through the year but began to diverge more significantly from May onward. In September, the average sold price ($836,104) was the closest it has been to the average list price ($846,673) all year, indicating that list prices may be more accurately representing supply and demand.
Quick Stats
- Absorption Rate: 10.7 months
- Sold-to-List Ratio: 95.39%
- Average Sold Price: $836,104
- Average List Price: $846,673
- Price Per Square Foot: $360.25
- List Price Per Square Foot: $377.15
Key Takeaways

The September 2025 STR sales tracker reveals a market that, while still active, is showing signs of adjustment. Key takeaways include:
- Price Softening: The gap between the list and sold prices suggests some price softening as demand stabilizes.
- Market Saturation: An increase in active listings without a corresponding increase in demand is a sign that the market may be nearing saturation, leading to increased competition among sellers.
- Large Homes in Gatlinburg: Larger homes, particularly in Gatlinburg, continue to command higher prices, reflecting buyer preferences for larger properties, perhaps due to the popularity of group vacations or multi-family rentals.
- Market Adjustments: Sellers may need to adjust their expectations as inventory increases and buyer demand begins to plateau.
Final Thoughts
While the Smoky Mountain short-term rental market remains strong, trends suggest a market correction, with prices softening and competition increasing as supply outpaces demand. STR investors and sellers should be prepared for a more balanced market moving forward, with adjustments in pricing and strategy likely necessary to stay competitive.
Are you interested in investing in the Smoky Mountains? The experts at Local Realty Group are here to help! Contact us today to learn more and get started!